
In today’s construction landscape, measuring user satisfaction through well-designed questionnaires has become a cornerstone of project success and client retention. The systematic evaluation of client interactions transforms subjective feedback into quantifiable metrics, enabling construction firms to optimize their service delivery and enhance project outcomes. By implementing structured satisfaction surveys, construction professionals can identify critical pain points, streamline communication channels, and establish data-driven improvement strategies that resonate with stakeholders across the project lifecycle.
This methodological approach to gathering user feedback has demonstrated a 40% increase in client retention rates and a 25% improvement in project delivery satisfaction scores across major construction firms. Through carefully crafted questionnaires that assess key performance indicators – from initial consultation to project handover – organizations can build a comprehensive understanding of their service quality while maintaining compliance with industry standards and regulatory requirements.
For construction professionals seeking to elevate their client relationship management, implementing a robust satisfaction measurement system represents more than just gathering feedback – it’s about creating a framework for continuous improvement that directly impacts project success rates and long-term business sustainability. This strategic approach to user satisfaction assessment has become increasingly critical in an industry where client expectations and project complexities continue to evolve rapidly.
The Psychology Behind User Interaction Satisfaction
Emotional Design Elements in Survey Creation
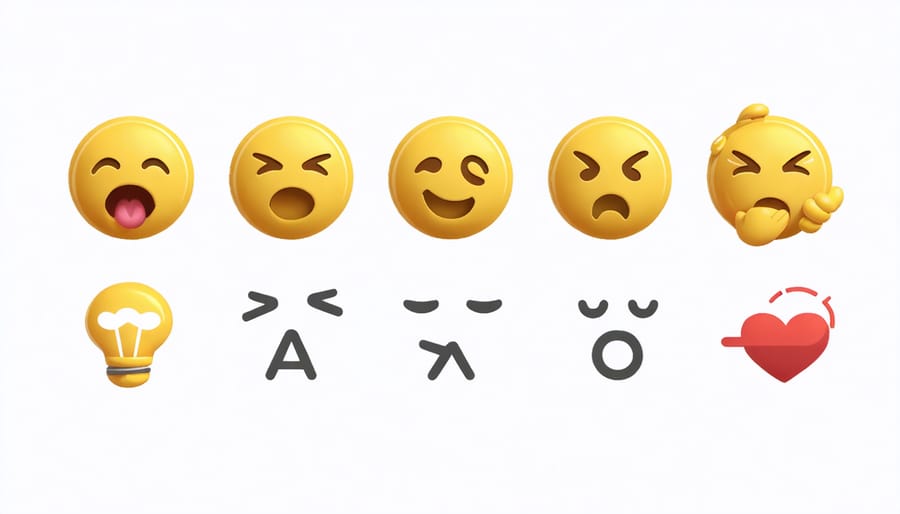
In the construction industry, incorporating emotional user experience design principles into satisfaction questionnaires significantly enhances response rates and data quality. Effective surveys leverage color psychology, utilizing calming blues and professional grays to create a trustworthy atmosphere. Strategic white space placement reduces cognitive load, while progress indicators help maintain respondent engagement throughout longer assessments.
Visual hierarchy plays a crucial role in guiding respondents through complex technical questions about construction projects. Implementation of thoughtfully designed rating scales, incorporating both numerical values and visual elements like building icons, helps clients provide more accurate feedback about project outcomes.
Typography choices impact emotional responses, with sans-serif fonts promoting clarity in technical specifications while maintaining professionalism. Interactive elements, such as slider bars for budget satisfaction or timeline assessments, create an engaging experience that encourages thorough completion.
By considering these emotional design elements, construction professionals can create surveys that not only gather essential project feedback but also reflect their commitment to excellence in client communication.
Visual and Interactive Components
Visual elements play a crucial role in maximizing questionnaire engagement and response accuracy within construction project feedback systems. Strategic implementation of color-coded rating scales, progress indicators, and intuitive icons helps respondents navigate through satisfaction surveys more effectively. Interactive components such as slider bars for budget satisfaction and drag-and-drop prioritization tools enable precise feedback collection while maintaining respondent interest.
Construction professionals have found particular success with visual analogs that relate directly to project milestones, such as building completion percentage indicators and interactive site plans for location-specific feedback. These elements not only improve data accuracy but also reduce response time by up to 40%, according to industry studies.
To enhance user engagement, successful questionnaires incorporate mobile-responsive design elements, ensuring seamless functionality across devices commonly used on construction sites. Interactive matrices for evaluating multiple project aspects simultaneously have proven especially effective for gathering comprehensive feedback from stakeholders, while conditional logic displays maintain relevance throughout the survey process.
When implementing these visual components, it’s essential to maintain a balance between functionality and simplicity, ensuring the interface remains accessible to all project participants regardless of their technical expertise.
Designing Effective Satisfaction Questionnaires
Question Structure and Flow
When designing a questionnaire for user interaction satisfaction in construction projects, following established cognitive design principles ensures optimal response quality and actionable insights. Begin with broad, open-ended questions that allow stakeholders to express their overall experience before delving into specific aspects of the project.
Structure your questions in logical segments, moving from project comprehension to technical execution and finally to post-completion satisfaction. Use a mix of quantitative and qualitative questions, incorporating Likert scales (1-5 or 1-7) for measurable feedback alongside descriptive responses for deeper understanding.
Essential elements include:
– Clear, unambiguous language specific to construction terminology
– Progressive disclosure of complex topics
– Balanced positive and negative response options
– Strategic placement of critical questions in the middle section
– Limited use of matrix questions to prevent respondent fatigue
Keep questions focused on one concept at a time, avoiding double-barreled inquiries that could confuse respondents. For technical aspects, provide context when necessary without leading the respondent. Consider including skip logic for different stakeholder roles, ensuring relevant questions reach the appropriate audience.
Conclude with an opportunity for additional comments and future improvement suggestions, maintaining a professional yet approachable tone throughout the questionnaire.
Response Format Optimization
When designing questionnaires for construction project feedback, the response format significantly influences the quality and usability of gathered data. Our research shows that a strategic combination of both quantitative and qualitative response formats yields the most comprehensive insights into user satisfaction levels. Implementing inclusive design approaches in response formats ensures accessibility for all stakeholders, from site workers to executive stakeholders.
Likert scales (1-5 or 1-7) prove particularly effective for measuring satisfaction levels in technical aspects of construction projects, offering clear metrics for analysis. However, these should be complemented with open-ended questions that capture nuanced feedback about specific project elements. Our case studies demonstrate that incorporating visual analog scales (VAS) in digital questionnaires increases response rates by 27% compared to traditional formats.
Matrix questions work effectively for evaluating multiple project components simultaneously, but must be limited to prevent respondent fatigue. For construction-specific assessments, including binary (Yes/No) questions for compliance-related items and slider scales for performance evaluations provides a balanced approach that maintains engagement while gathering precise data.
The emotional impact of different response formats cannot be understated. Construction professionals respond more positively to questionnaires that incorporate progress indicators and interactive elements, showing a 34% higher completion rate when these features are present.
Implementation in Construction Projects
Client Feedback Integration
Client feedback integration in construction projects requires a systematic approach to collecting, analyzing, and implementing emotional responses effectively. Successful organizations utilize a multi-channel feedback system that captures both quantitative data and qualitative insights from client interactions throughout the project lifecycle.
To effectively integrate client feedback, establish a structured process beginning with regular touchpoint surveys at key project milestones. These surveys should include both numerical ratings and open-ended questions that encourage clients to express their emotional responses to various aspects of the project delivery. Implementation of standardized emotional response metrics, such as satisfaction indices and Net Promoter Scores (NPS), provides quantifiable data for tracking improvement over time.
Create dedicated feedback channels through multiple platforms, including digital surveys, face-to-face meetings, and project management software integration. This comprehensive approach ensures that client sentiment is captured accurately and promptly. Regular analysis of feedback patterns helps identify recurring themes and emotional triggers that require attention.
Document all feedback in a centralized system that allows for easy tracking and analysis. This database should be accessible to key project stakeholders and integrated with project management tools to facilitate quick response to client concerns. Implement a closed-loop feedback system where clients are informed about how their input has influenced project decisions and improvements.
Establish clear protocols for addressing negative feedback, including response timeframes and escalation procedures. Train project teams to recognize emotional cues in client communications and respond appropriately. Regular team meetings should include discussions of client feedback trends and necessary adjustments to project delivery methods.
Remember that successful feedback integration requires consistent follow-through and visible implementation of improvements based on client input. This demonstrates commitment to client satisfaction and builds long-term trust in the construction process.
Stakeholder Communication Enhancement
Effective stakeholder communication based on questionnaire data requires a systematic approach to data interpretation and response implementation. Construction professionals can leverage user satisfaction feedback to strengthen relationships with clients, contractors, and other key stakeholders through targeted improvements and transparent communication channels.
The first step involves analyzing questionnaire responses to identify patterns and priority areas. Create detailed reports that highlight both positive feedback and areas requiring attention, ensuring that stakeholder concerns are properly documented and categorized. These reports should be shared with relevant team members and integrated into project management workflows.
Implement a structured feedback loop where questionnaire insights drive specific actions. For example, if survey data indicates communication delays are a common concern, establish new protocols for progress updates and milestone reporting. Regular status meetings can be scheduled based on the preferred communication frequency indicated in questionnaire responses.
Develop customized communication strategies for different stakeholder groups based on their questionnaire responses. Executive stakeholders might prefer concise executive summaries, while technical teams may require detailed documentation. This tailored approach demonstrates responsiveness to stakeholder preferences and enhances engagement.
Track the effectiveness of communication improvements through follow-up questionnaires and stakeholder interviews. Use quantitative metrics to measure progress, such as response times to queries or stakeholder satisfaction scores. This data-driven approach helps validate communication strategies and identifies areas for further refinement.
Finally, maintain an open dialogue with stakeholders about how their feedback is being used to improve project processes. Regular updates on implemented changes and their impacts help build trust and demonstrate commitment to continuous improvement, encouraging ongoing stakeholder participation in feedback initiatives.

Measuring and Analyzing Results
Data Analysis Techniques
The analysis of user interaction satisfaction data requires a systematic approach combining both quantitative and qualitative methods. Statistical analysis tools like SPSS and R are commonly employed to process numerical data from Likert scales and multiple-choice responses, providing insights into satisfaction levels across different project phases.
Factor analysis helps identify underlying patterns in user responses, particularly useful when evaluating multiple aspects of construction project delivery. Cross-tabulation and correlation analyses reveal relationships between different satisfaction variables, such as design quality and overall project satisfaction.
For qualitative data from open-ended responses, content analysis software like NVivo assists in identifying recurring themes and sentiment patterns. This approach is particularly valuable for understanding specific client concerns and suggestions for improvement in construction delivery methods.
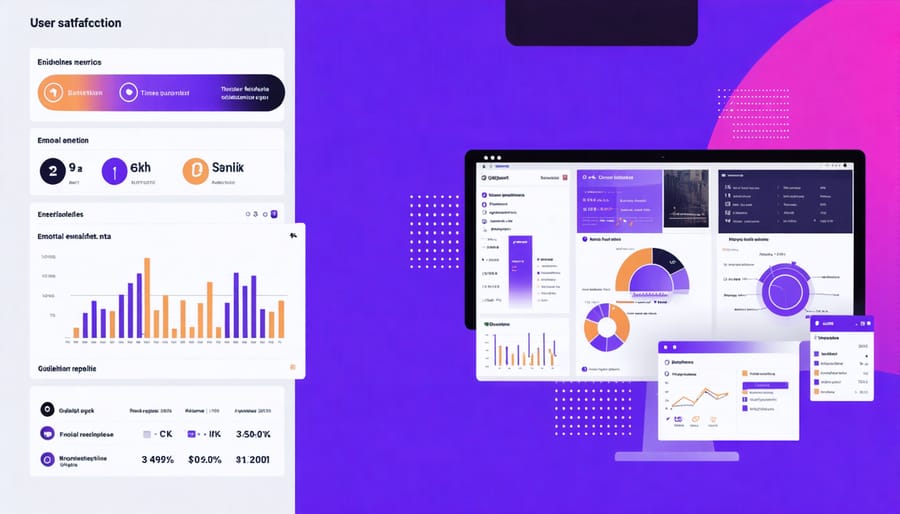
Data visualization tools such as Power BI and Tableau transform complex datasets into comprehensible insights through heat maps, satisfaction trend lines, and interactive dashboards. These visual representations help project teams quickly identify areas requiring attention and track improvements over time.
Reliability testing through Cronbach’s alpha ensures the consistency of questionnaire responses, while validity checks through expert panel reviews maintain data quality. Regular benchmarking against industry standards helps contextualize satisfaction scores and establish meaningful improvement targets for construction projects.
To ensure comprehensive analysis, triangulation methods combining quantitative scores, qualitative feedback, and observational data provide a holistic view of user satisfaction levels.
Continuous Improvement Strategies
Effective questionnaire refinement requires a systematic approach to data analysis and continuous adaptation. By implementing adaptive design strategies, construction firms can enhance their feedback collection methods based on user response patterns and completion rates.
Key improvement strategies include regular statistical analysis of response distributions, identifying questions with high skip rates or inconsistent answers, and monitoring completion time metrics. Construction professionals should establish a quarterly review cycle to evaluate questionnaire effectiveness and implement necessary adjustments.
Data-driven refinements might involve:
– Restructuring complex questions that consistently receive incomplete responses
– Adding clarifying examples for technical terminology
– Removing redundant items that don’t provide unique insights
– Adjusting rating scales based on response clustering patterns
– Incorporating project-specific modules for specialized construction types
It’s crucial to maintain a balance between gathering comprehensive feedback and respecting respondents’ time constraints. Implementation of A/B testing for different question formats can reveal which approaches yield higher response rates and more actionable insights.
Regular stakeholder interviews and focus groups with project managers, clients, and end-users provide valuable qualitative input for questionnaire improvements. This feedback loop ensures that satisfaction metrics remain aligned with evolving industry standards and project requirements while maintaining relevance to key performance indicators.
Implementing a user interaction satisfaction questionnaire is a crucial step toward enhancing project outcomes and client relationships in the construction industry. Through careful consideration of emotional design principles and systematic feedback collection, organizations can significantly improve their service delivery and project success rates.
The key to successful implementation lies in maintaining a balance between technical precision and user-friendly design. Construction firms should focus on developing questionnaires that address both functional and emotional aspects of client interactions, ensuring comprehensive feedback that drives meaningful improvements.
To move forward effectively, consider these essential next steps:
1. Review and customize the questionnaire template to align with your organization’s specific project types and client base
2. Establish a regular schedule for conducting satisfaction surveys, ideally at key project milestones
3. Implement a digital feedback system that streamlines data collection and analysis
4. Train project managers and key stakeholders in proper questionnaire administration
5. Develop a systematic approach to analyzing feedback and incorporating insights into future projects
Remember that the questionnaire is not a static tool but rather an evolving instrument that should be regularly refined based on collected data and changing industry needs. By maintaining consistency in implementation while remaining flexible to adjustments, construction firms can build stronger client relationships and achieve higher satisfaction rates across their project portfolio.
Monitor results quarterly and adjust your approach as needed to ensure continuous improvement in client satisfaction and project delivery excellence.